
The latest welfare statistics are from year-end 2012. Those figures show 35.4 Percent: 109,631,000 on Welfare.
109,631,000 living in households taking federal welfare benefits as of the end of 2012, according to the Census Bureau, equaled 35.4 percent of all 309,467,000 people living in the United States at that time.
When those receiving benefits from non-means-tested federal programs — such as Social Security, Medicare, unemployment and veterans benefits — were added to those taking welfare benefits, it turned out that 153,323,000 people were getting federal benefits of some type at the end of 2012.
Subtract the 3,297,000 who were receiving veterans' benefits from the total, and that leaves 150,026,000 people receiving non-veterans' benefits.
The 153,323,000 total benefit-takers at the end of 2012, said the Census Bureau, equaled 49.5 percent of the population. The 150,026,000 taking benefits other than veterans' benefits equaled about 48.5 percent of the population.
In 2012, according to the Census Bureau, there were 103,087,000 full-time year-round workers in the United States (including 16,606,000 full-time year-round government workers). Thus, the welfare-takers outnumbered full-time year-round workers by 6,544,000.
Breakdown by Category
82,679,000 Medicaid
51,471,000 Food Stamps
22,526,000 Women, Infants and Children Program
20,355,000 Supplemental Security Income
13,267,000 Public Housing or Housing Subsidies
5,442,000 Temporary Assistance to Needy Families
4,517,000 Other Forms of Federal Cash Assistance
In early September 2014, the labor force participation rate dropped once again to 62.8% from 62.9%, matching the lowest since 1978, as a result of the people not in labor force rising once again, and hitting a new all time high record of 92,269,000, up 268,000 from the prior month.

In fact, in August the number of people not in the labor force increased by nearly double the number of people who found jobs, which as we reported previously, was only 142K.
Of the 142K jobs created, just under half came from the lowest paying jobs possible: education and health; leisure and hospitality; and temp-help. The best paying jobs, finance and information, added a whopping 4K jobs between them. Finally, about that much delayed US manufacturing renaissance: stick a fork in it - in August the number of manufacturing jobs created was exactly 0.

According to the WSJ, roughly one in three U.S. workers is now a freelancer. Fifty-three million Americans, or 34% of the nation’s workforce, qualify as freelancers, according to a new report from the Freelancers Union, a nonprofit organization, and Elance-oDesk Inc., a company that provides platforms for freelancers to find work. These individuals include independent contractors, temps, and moonlighters, among others.
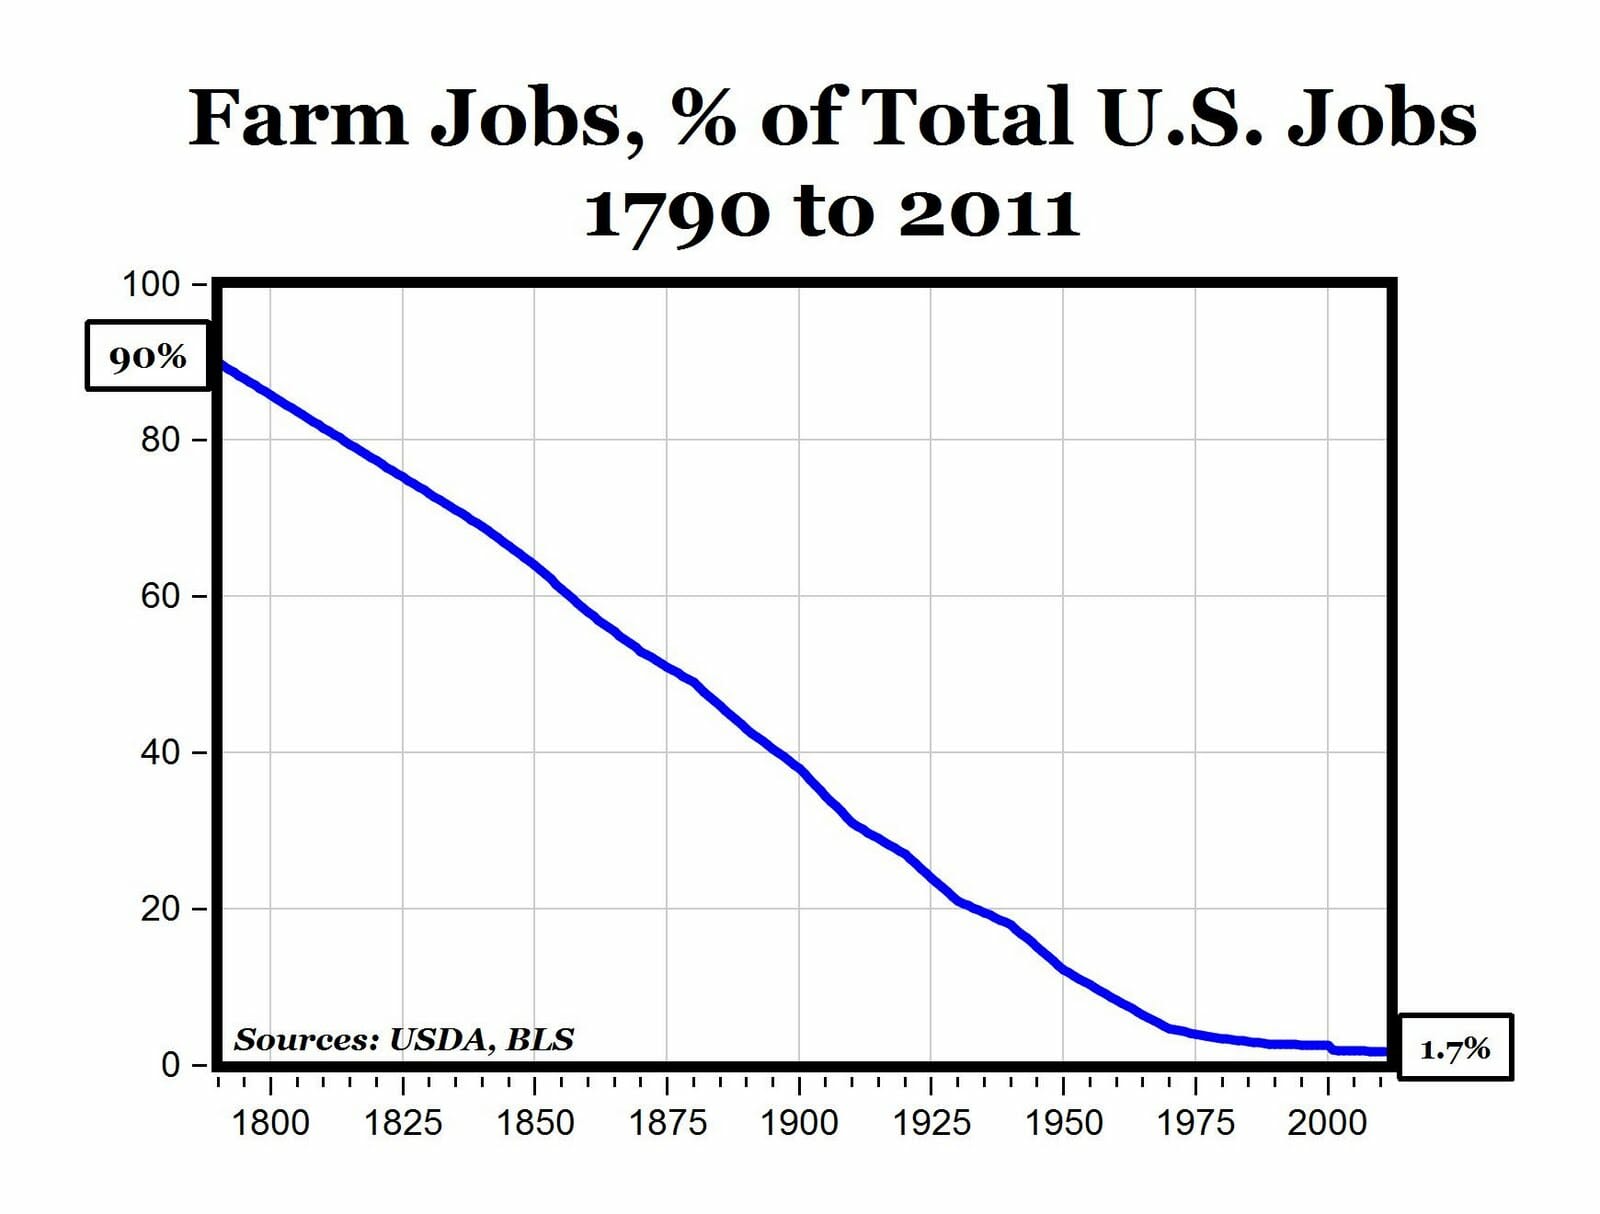
And how many people own their own farms and produce the food we eat? According to Voice of Agriculture, 2.2 million farms dot America’s rural landscape, 97 percent of which are operated by "families" – individuals, family partnerships or family corporations and farm and ranch families comprise just 2 percent of the U.S. population which continues to decline since the American Revolution.

Note that these "families" own massive acreage.

Note Nonfamily, Large Family, and Very Large Family ownership of farms is approximately 85%. That means for a family to get back into farming and leave the Matrix of the mega cities, they would face enormous competition from near monopolies.

In fact, in August the number of people not in the labor force increased by nearly double the number of people who found jobs, which as we reported previously, was only 142K.
Of the 142K jobs created, just under half came from the lowest paying jobs possible: education and health; leisure and hospitality; and temp-help. The best paying jobs, finance and information, added a whopping 4K jobs between them. Finally, about that much delayed US manufacturing renaissance: stick a fork in it - in August the number of manufacturing jobs created was exactly 0.
According to the WSJ, roughly one in three U.S. workers is now a freelancer. Fifty-three million Americans, or 34% of the nation’s workforce, qualify as freelancers, according to a new report from the Freelancers Union, a nonprofit organization, and Elance-oDesk Inc., a company that provides platforms for freelancers to find work. These individuals include independent contractors, temps, and moonlighters, among others.
And how many people own their own farms and produce the food we eat? According to Voice of Agriculture, 2.2 million farms dot America’s rural landscape, 97 percent of which are operated by "families" – individuals, family partnerships or family corporations and farm and ranch families comprise just 2 percent of the U.S. population which continues to decline since the American Revolution.
Note that these "families" own massive acreage.
Note Nonfamily, Large Family, and Very Large Family ownership of farms is approximately 85%. That means for a family to get back into farming and leave the Matrix of the mega cities, they would face enormous competition from near monopolies.
No comments:
Post a Comment